Midterm Elections and the Stock Market: What the Record Shows
PropFirmTrend Research ·
The S&P 500 was higher 12 months after each of the 20 US midterm elections from 1946 to 2022, by 14.8% on average. That is a record of the past, not a forecast. Twenty elections is a small sample, and the gains ranged from 0.8% to 33.0%.
The 2026 US midterm election is on November 3, 2026. This note sets out what the record shows, how it was measured, and where it stops. It makes no prediction and gives no investment advice.
Disclosure: Past results don't predict future returns. We earn commissions from some firms we list.
How did the S&P 500 do after past midterm elections?
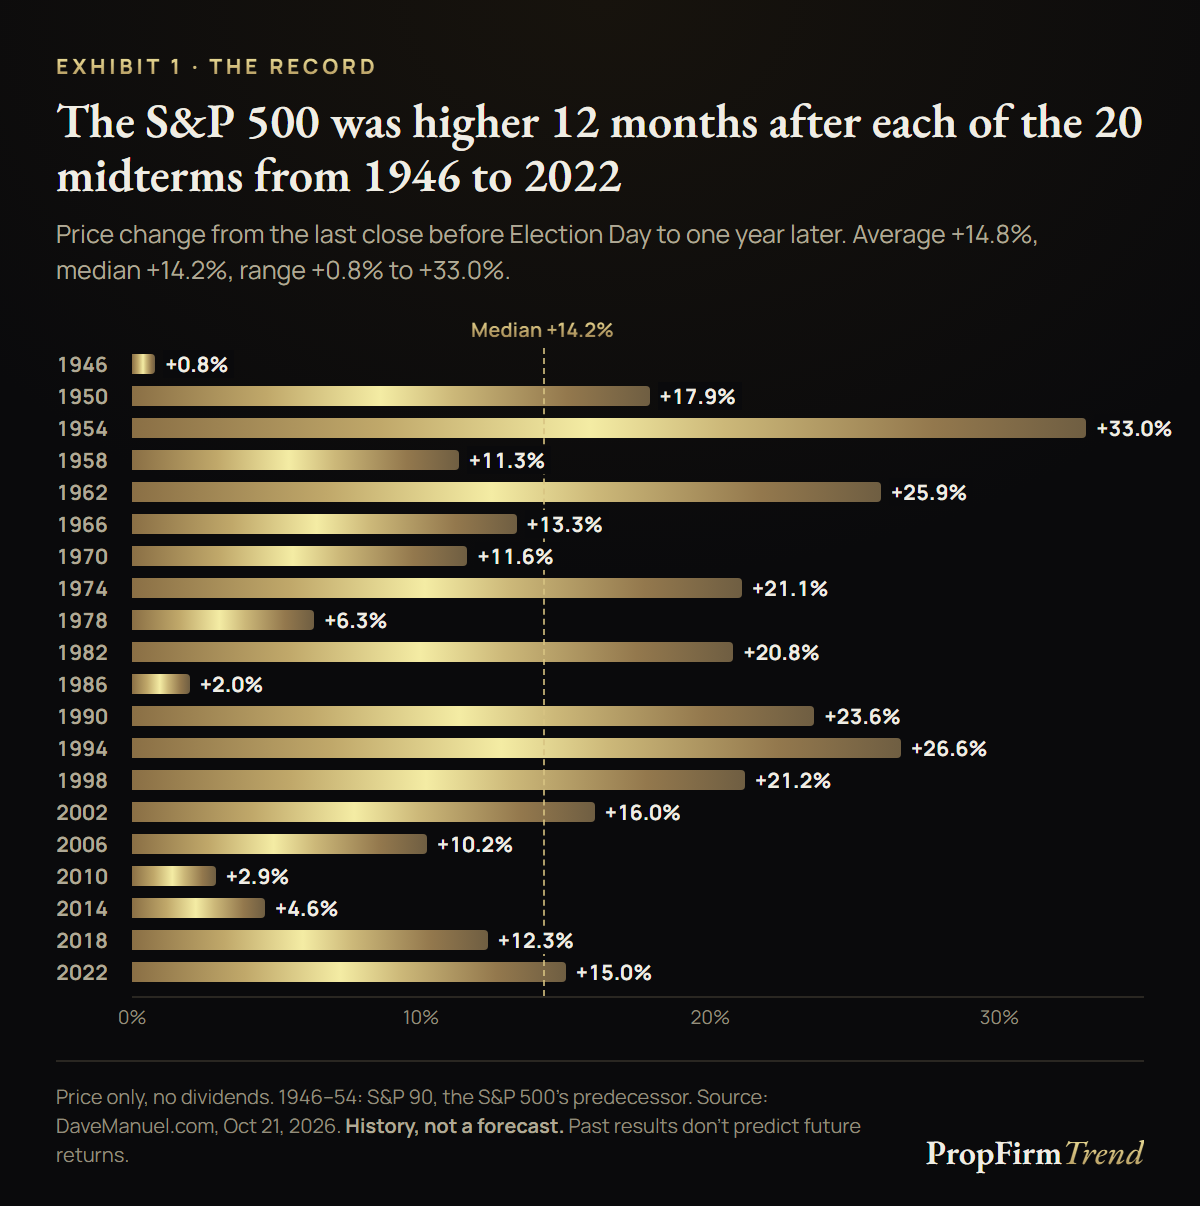
Exhibit 1. S&P 500 price change in the 12 months after each midterm, 1946 to 2022. Source: DaveManuel.com.
Twenty midterm elections took place from 1946 to 2022. Twelve months after each one, the S&P 500 stood higher than before the vote. The average gain was 14.8%. The median gain was 14.2%. The smallest gain was 0.8%, in 1946. The largest was 33.0%, in 1954. After the most recent midterm, in 2022, the index rose 15.0%, from 3,806.80 to 4,378.38.
How it was measured. Each figure is the price change from the last close before Election Day to the close one year later. Dividends are not included. For 1946 to 1954, the series uses the S&P 90, the predecessor of the S&P 500. The figures come from DaveManuel.com, published October 21, 2026. We checked the arithmetic: the 20 figures average 14.82%. In October 2022, Reuters reported the same pattern, then 19 midterms out of 19 through 2018, citing Deutsche Bank data.
The full record. 1946 +0.8%, 1950 +17.9%, 1954 +33.0%, 1958 +11.3%, 1962 +25.9%, 1966 +13.3%, 1970 +11.6%, 1974 +21.1%, 1978 +6.3%, 1982 +20.8%, 1986 +2.0%, 1990 +23.6%, 1994 +26.6%, 1998 +21.2%, 2002 +16.0%, 2006 +10.2%, 2010 +2.9%, 2014 +4.6%, 2018 +12.3%, 2022 +15.0%.
Is 20 out of 20 unusual for stocks?
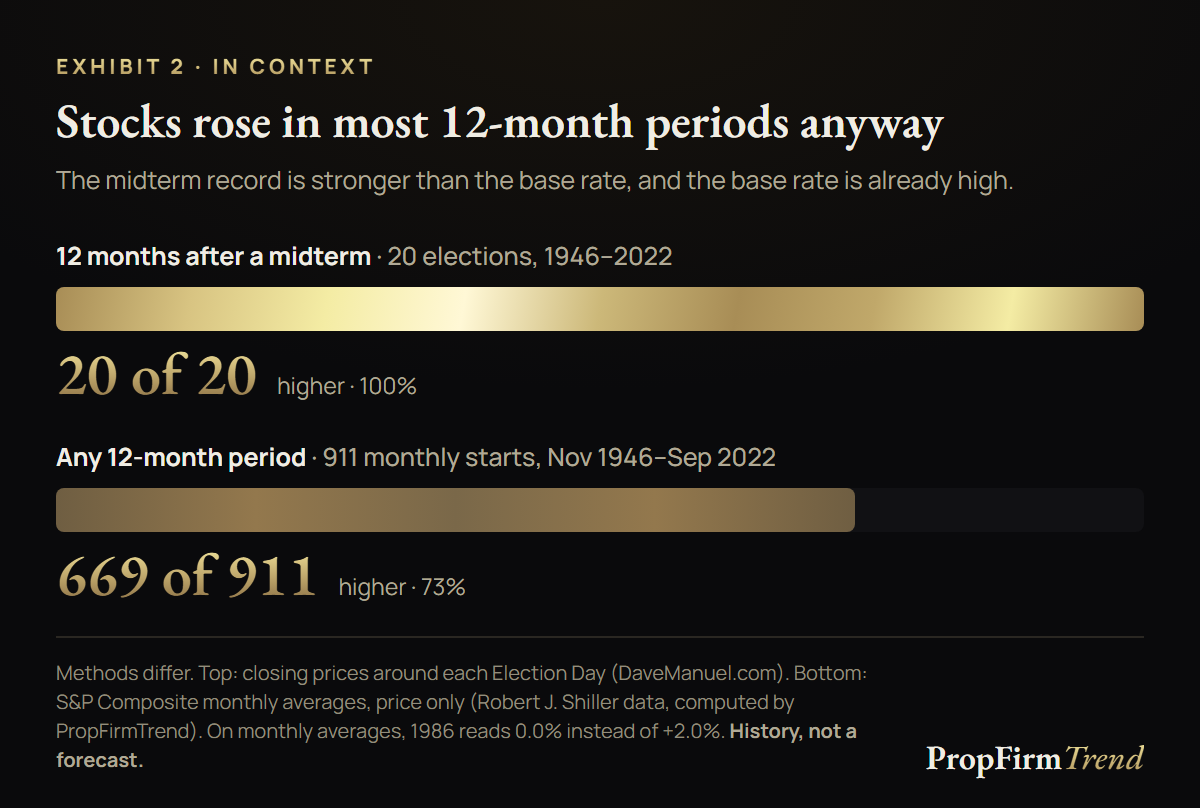
Exhibit 2. The midterm record against the base rate for all 12-month periods. Sources: DaveManuel.com; Robert J. Shiller's S&P Composite data, computed by PropFirmTrend.
It is less unusual than it looks, because US stocks rose in most 12-month periods anyway. We measured every 12-month window in Robert Shiller's S&P Composite data that starts between November 1946 and September 2022. That is 911 windows, one for each starting month. The index ended higher in 669 of them, or 73%. This measure uses monthly averages of daily closes and leaves out dividends.
So the base rate is about three in four. The midterm record is stronger than that base rate. It also starts from a high one.
The two measures are not identical, and the difference matters. On Shiller's monthly-average basis, the 12 months after the 1986 midterm read 0.0%, not +2.0%. A small change in the start or end date can turn a small gain into no gain. The record depends on the exact dates used.
Were the gains always large?
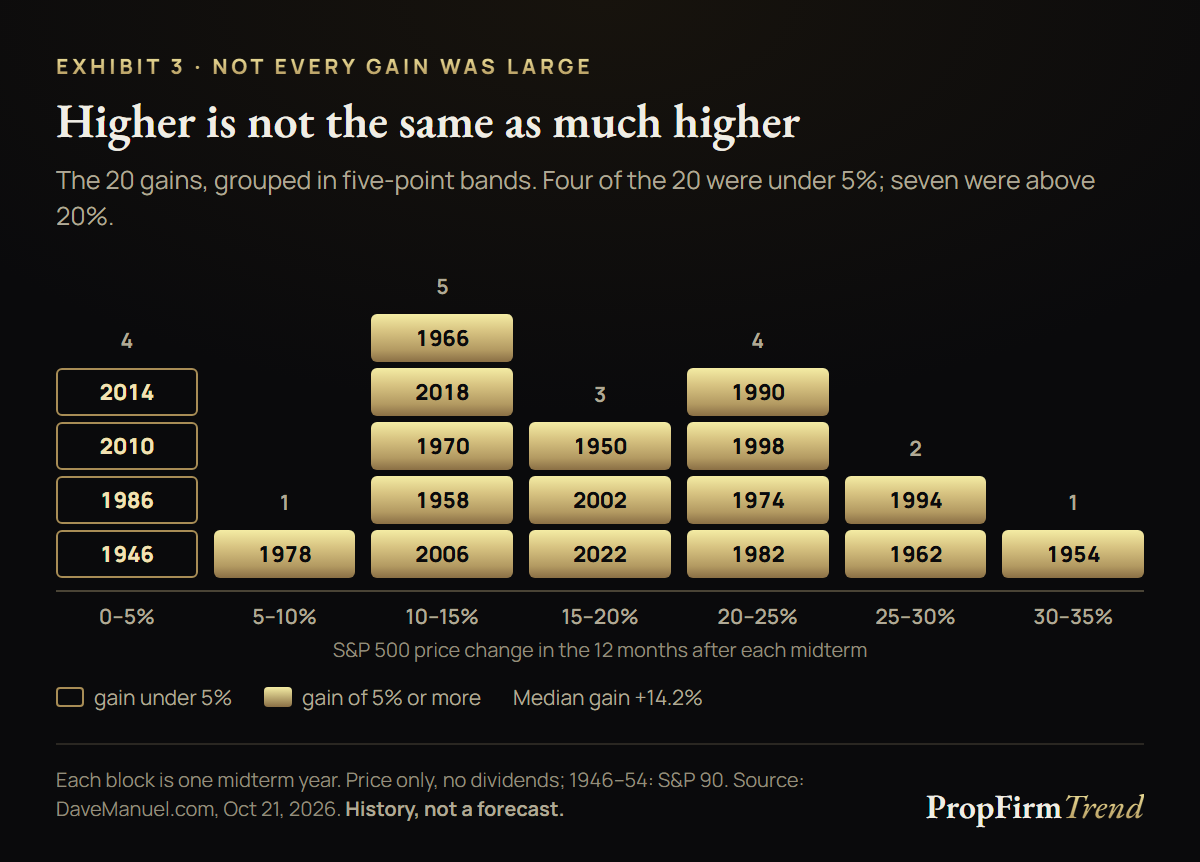
Exhibit 3. The 20 gains grouped in five-point bands. Source: DaveManuel.com.
No. The range was wide. Three of the 20 gains were under 3%: 1946 at +0.8%, 1986 at +2.0% and 2010 at +2.9%. A fourth, 2014, was +4.6%. So one midterm in five was followed by a gain under 5%. Seven of the 20 gains were above 20%.
Higher is not the same as much higher. In this record, all 20 periods ended higher, and in one of every five the gain was under 5%.
What happens to stocks during the midterm year itself?
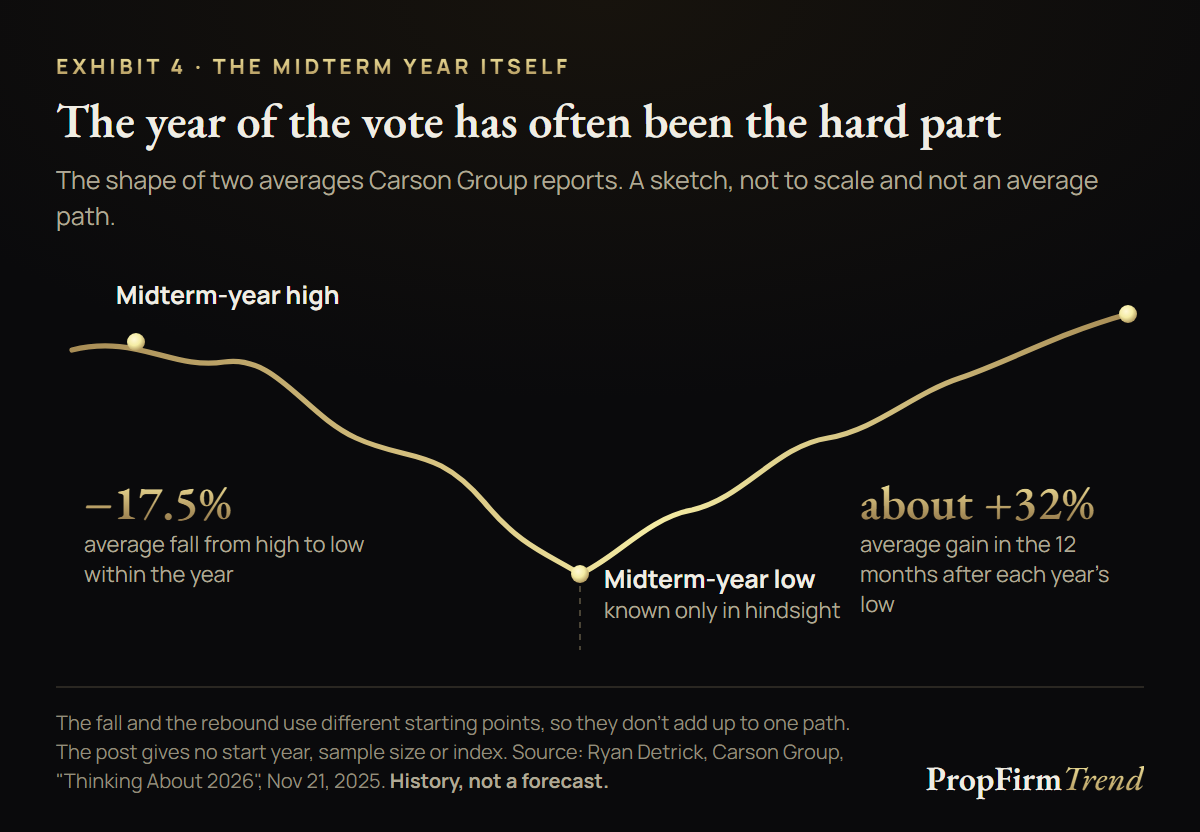
Exhibit 4. The shape of the averages Carson Group reports. An illustration, not an average path. Source: Carson Group, Ryan Detrick, November 21, 2025.
The 12 months after the vote are only part of the picture. The midterm year itself has often been the hard part. Ryan Detrick of Carson Group wrote in November 2025 that midterm years saw an average peak-to-trough fall of 17.5% within the year. He also wrote that stocks were up nearly 32% on average one year after each midterm-year low. In the same post, he put the average date of that low at August 18, with a median of September 29. He also noted that midterm years gained less than 5% on average. The post does not state the start year, the number of years or the index behind these figures.
Two cautions apply to the 32%. First, it runs from each year's actual low, a date known only in hindsight. No one could have bought every low in real time. Second, the fall and the rebound are measured from different starting points. They cannot be added together into one path, which is why Exhibit 4 is a sketch and not a chart.
John J. Murphy described a related tendency in Intermarket Analysis (2012). He wrote that US stocks have tended to bottom about every four years, usually around the midterm election. He noted that this pattern is known as the presidential cycle, and that most of the bottoms he listed came in the second half of the year.
What happens to volatility around the vote?
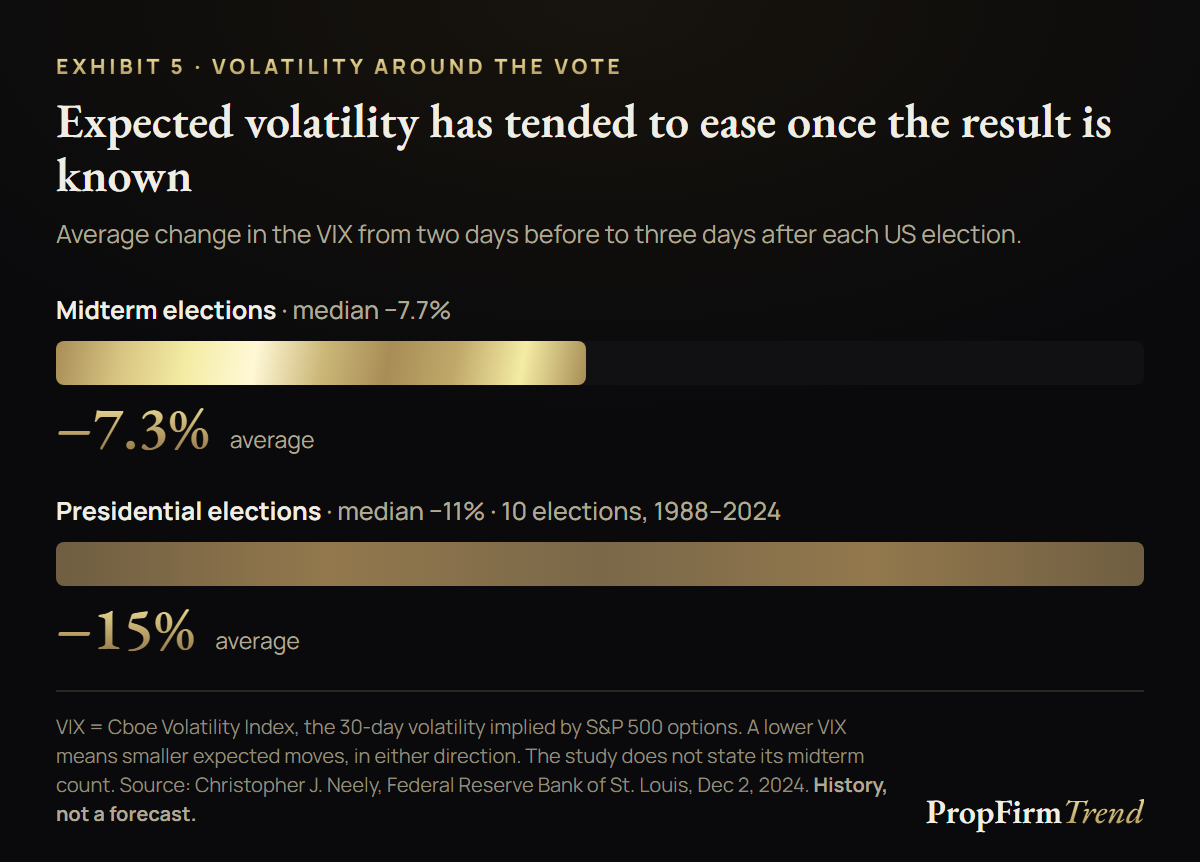
Exhibit 5. Average change in the VIX around US elections. Source: Christopher J. Neely, Federal Reserve Bank of St. Louis, December 2, 2024.
Expected volatility has tended to ease once the result is known. The VIX is the Cboe Volatility Index. It measures the volatility that S&P 500 options imply for the next 30 days.
Christopher J. Neely of the Federal Reserve Bank of St. Louis measured how the VIX changed from two days before to three days after US elections. Around midterm elections, the VIX fell 7.3% on average, with a median fall of 7.7%. Around presidential elections, it fell 15% on average, with a median fall of 11%. The presidential figures cover the 10 elections from 1988 to 2024. The study does not state how many midterms it includes. The span from 1988 to 2024 holds nine, from 1990 to 2022.
One reading is that the vote removes a known uncertainty, so the expected range narrows. That reading is ours, not the study's. A lower VIX says something about the expected size of moves. It says nothing about their direction.
What did the S&P 500 do the day after past midterms?
The day after the vote has been quieter for midterms than for presidential elections. Schaeffer's Research looked at the S&P 500 on the first trading day after Election Day, in an article by Rocky White dated October 26, 2022. After midterms, the index rose 0.65% on average and closed higher 78% of the time. After presidential elections, it fell 0.31% on average and closed higher 44% of the time. The article frames its data as going back to 1950, but it does not state the window or the number of elections for this table. Its midterm data end in 2018, so the 2022 day-after move is not in it.
Why would an election matter to markets at all?
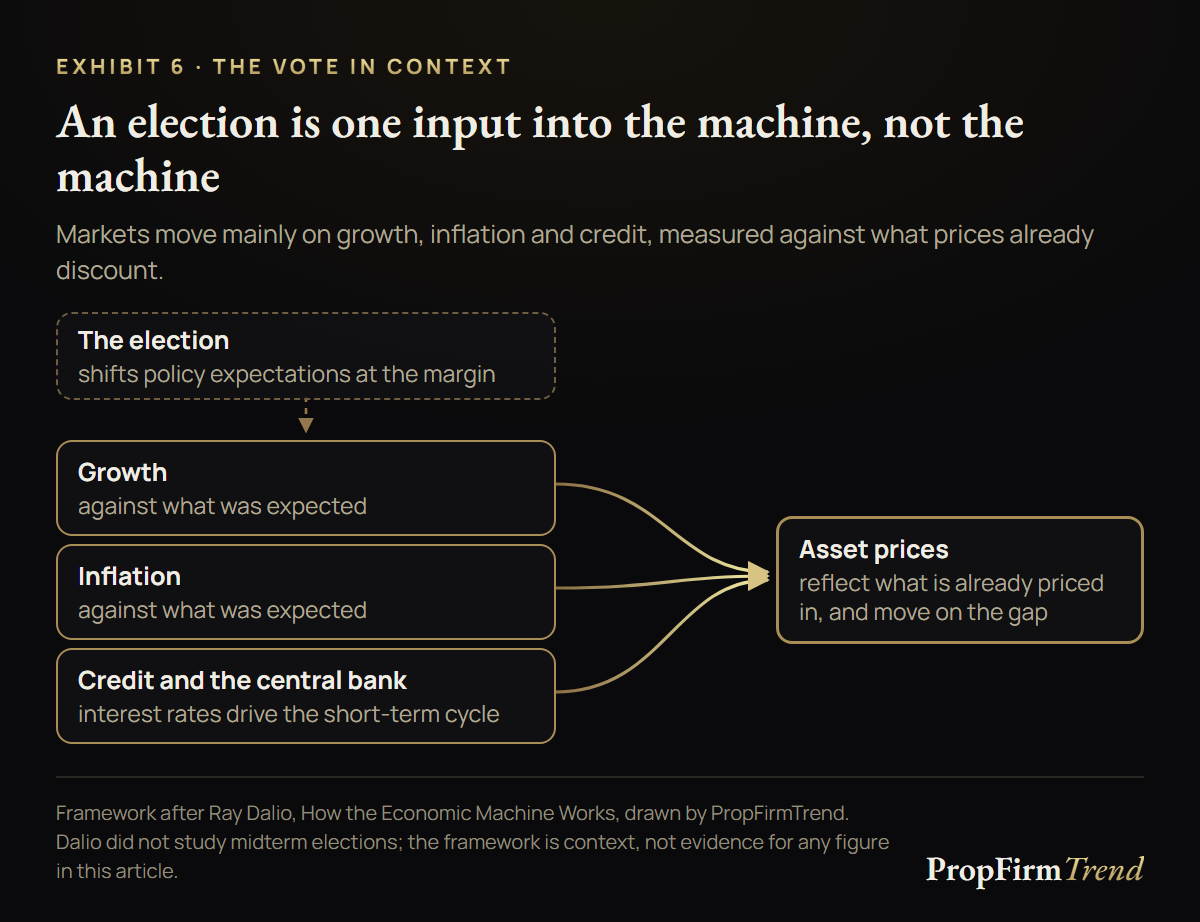
Exhibit 6. Where an election fits in a framework from Ray Dalio's How the Economic Machine Works. Drawn by PropFirmTrend.
A framework helps here. "The economy is like a machine," Ray Dalio writes in How the Economic Machine Works. In his framework, markets move mainly on growth, inflation and credit, measured against what prices already discount. Central banks drive the short-term credit cycle through interest rates. In his 2010 paper "Engineering Targeted Returns and Risks", equities are among the assets that do badly when growth falls short of expectations.
Read through that lens, an election is one input into the machine. It can shift expectations for fiscal policy, regulation and taxes at the margin. It does not set the Federal Reserve's policy rate. It does not decide growth or inflation by itself.
Dalio did not study midterm elections. Nothing in his work speaks to the midterm record above. We use his framework only to place the vote in context.
What does the record not tell you?
It is a small sample. Twenty elections give 20 data points. One different year would move the average.
It sits on a high base rate. In Shiller's data, stocks rose in 73% of all 12-month windows starting from November 1946 to September 2022.
It depends on the dates. On monthly averages, the 1986 window reads 0.0% rather than +2.0%.
It skips the path. The record compares two dates a year apart. It does not show the falls in between.
It has a start date. The record begins in 1946. Earlier midterms, such as 1930 during the Great Depression, are not in it.
It is not a forecast. The record describes the 20 midterms from 1946 to 2022. It does not describe the 12 months after November 3, 2026.
Trading tonight? Check your firm's rules first
Most results arrive after the US stock market closes at 4:00 PM ET. Stock index futures and perpetual contracts (perps) keep trading overnight, so the first reaction to results shows up there. Every prop firm sets its own rules for that window. Before you hold a position into the results, check these with your firm.
News-event rules. Does your firm restrict trading around news, and does an election count as a news event? If the rules list specific events and do not name elections, ask support before the evening, not during it.
Overnight and close rules. Must positions be flat by a set time each day?
Drawdown type. Does your drawdown trail intraday, update at the end of the day, or stay static?
Daily loss limit. Does hitting it close the account, or only stop trading for the day?
Spreads and fills. Overnight liquidity is thinner than during the regular session, and spreads can widen around fast news.
You can compare firms' drawdown, news and overnight rules side by side on PropFirmTrend. None of this is trading advice.
Frequently asked questions
Do stocks go up after midterm elections?
In the record from 1946 to 2022, the S&P 500 was higher 12 months after all 20 midterms, by 14.8% on average, price only. That describes the past. It does not predict the next 12 months.
What is the presidential cycle?
It is the name for a historical tendency of US stocks to make a low around the midterm year and to rise in the period after it. John J. Murphy describes it in Intermarket Analysis (2012). It is a tendency in past data, not a rule.
Does it matter which party wins the midterms?
Published studies disagree on whether a divided or a unified Congress has mattered for stocks. We do not draw a conclusion from them.
What is the VIX?
The VIX is the Cboe Volatility Index. It measures the 30-day volatility implied by S&P 500 option prices. It rises when traders pay more to protect against large moves, and it says nothing about direction.
How has the S&P 500 done in 2026 so far?
First Trust reported a total return of 12.7% from December 31, 2025 to September 30, 2026. The largest peak-to-trough fall in that period was 9.1%. Those are total-return figures, including dividends, so they do not compare one for one with the price-only figures above. A year to date says nothing about the next 12 months.
When does the 2026 midterm enter the record?
The 12-month change after the 2026 midterm can be measured in November 2027. We plan to add it to this page then.
Is this investment advice?
No. This is market history for education. It does not recommend buying, selling or holding anything.
Sources and method
All S&P 500 figures are price changes without dividends unless marked as total return. Averages and the base rate were checked or computed by PropFirmTrend from the sources below.
DaveManuel.com, "Stocks After Midterm Elections: 80 Years of Data", October 21, 2026.
Reuters via Yahoo News, "Recession fears threaten perfect track record of post-midterm U.S. stock gains", October 27, 2022.
Robert J. Shiller, U.S. stock market data (ie_data.xls), version saved September 17, 2023. Base rate computed by PropFirmTrend: the 12-month change of the S&P Composite monthly average for every start month from November 1946 to September 2022.
Ryan Detrick, Carson Group, "Thinking About 2026", November 21, 2025.
Christopher J. Neely, Federal Reserve Bank of St. Louis, "What Happens to Expected Stock Volatility around Election Day?", On the Economy, December 2, 2024.
Rocky White, Schaeffer's Research, "What Election Day Means for the S&P 500", October 26, 2022.
First Trust Economics, "Three on Thursday: S&P 500 Index Through Q3 2026", October 22, 2026.
John J. Murphy, Intermarket Analysis, second edition (Wiley, 2012), chapter 8, pages 91 to 92.
Ray Dalio, How the Economic Machine Works, in Economic Principles (draft, 2015), page 1 and the chapter on the short-term debt cycle. Ray Dalio, "Engineering Targeted Returns and Risks" (2010).
History, not a forecast. Past results don't predict future returns. We earn commissions from some firms we list.